Market structure trading has become one of the most important concepts in modern technical analysis. Instead of relying purely on indicators, traders use market structure to understand how price moves, where liquidity sits and how institutions position themselves within the market.
Professional traders, hedge funds and smart money participants analyse market structure to identify trends, reversals and liquidity opportunities before major price movements occur. As trading technology evolves, platforms like Bookmap are increasingly used to combine market structure analysis with real-time liquidity and order flow data.
Whether you trade forex, futures, stocks or cryptocurrency, understanding market structure can significantly improve trade timing, risk management and overall market awareness.
What Is Market Structure in Trading?
Market structure refers to the way price moves within the market over time. It is the foundation of price action trading and helps traders determine whether the market is trending, reversing or consolidating.
At its core, market structure analysis focuses on:
- Higher highs
- Higher lows
- Lower highs
- Lower lows
- Trend continuation
- Trend reversals
By studying these patterns, traders can understand who is controlling the market and where price is likely to move next.
Unlike lagging indicators, market structure provides direct insight into how buyers and sellers are interacting in real time.
Understanding Market Structure in Financial Markets
Every market moves through phases:
- Accumulation
- Expansion
- Distribution
- Reversal
Understanding these phases is essential for successful trading.
Why Market Structure Matters
Market structure helps traders:
- Identify trend direction
- Find high-probability entries
- Avoid trading against momentum
- Understand liquidity behaviour
- Anticipate reversals
Professional traders often combine market structure analysis with tools like Bookmap to visualise liquidity, absorption and institutional positioning around key structural levels.
Bullish vs Bearish Market Structure
Understanding bullish and bearish structure is one of the first steps in learning price action trading.
Bullish Market Structure
A bullish market structure forms when price creates:
- Higher highs
- Higher lows
This indicates buyers remain in control.
Characteristics of Bullish Structure
- Strong momentum
- Pullbacks holding support
- Breakouts above resistance
- Increasing liquidity participation
Bearish Market Structure
A bearish market structure forms when price creates:
- Lower highs
- Lower lows
This suggests sellers are dominating the market.
Characteristics of Bearish Structure
- Failed rallies
- Aggressive selling
- Breakdown continuation
- Weak buying pressure
Ranging Market Structure
Markets do not trend constantly. Consolidation phases occur when buyers and sellers remain balanced.
Range conditions often lead to:
- Liquidity accumulation
- False breakouts
- Volatility expansion later
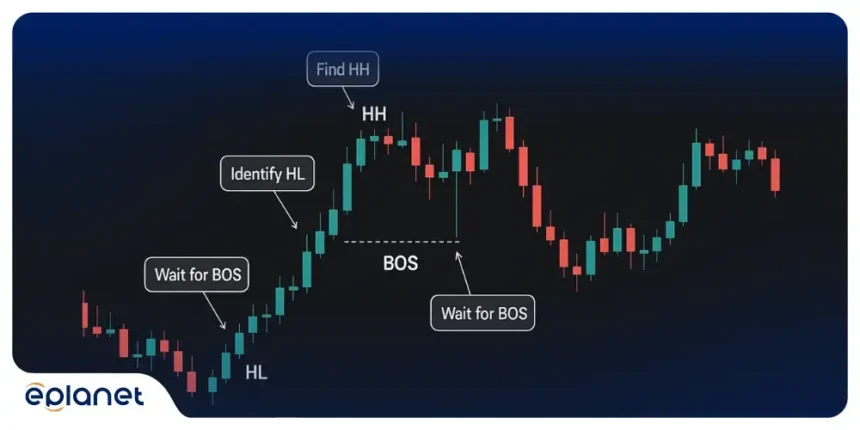
How to Identify a Break of Structure (BOS)
A Break of Structure, commonly known as BOS, occurs when price breaks a previous swing high or swing low in the direction of the trend.
BOS is one of the most important concepts in modern market structure trading.
Bullish BOS
A bullish BOS occurs when price breaks above a previous high.
This signals:
- Continuation strength
- Buyer dominance
- Potential trend expansion
Bearish BOS
A bearish BOS occurs when price breaks below a previous low.
This suggests:
- Selling pressure
- Trend continuation
- Weak buyer participation
Why BOS Matters
Breaks of structure help traders:
- Confirm trends
- Avoid fake breakouts
- Align with institutional momentum
Many traders use Bookmap alongside BOS analysis to confirm whether liquidity and order flow support the breakout.
What Is Change of Character (CHoCH) in Trading?
Change of Character, or CHoCH, refers to an early shift in market direction before a full trend reversal develops.
CHoCH is heavily used within smart money concepts and institutional trading methodologies.
Bullish CHoCH
Occurs when bearish structure begins failing and buyers regain control.
Bearish CHoCH
Occurs when bullish structure weakens and sellers start taking over.
CHoCH vs BOS
| CHoCH | BOS |
| Early reversal signal | Trend continuation signal |
| Indicates transition | Indicates confirmation |
| Often appears first | Usually follows later |
Understanding the relationship between BOS and CHoCH helps traders anticipate reversals earlier.
Market Structure vs Order Flow
Market structure and order flow are closely connected, but they analyse different aspects of the market.
| Market Structure | Order Flow |
| Focuses on swing highs/lows | Focuses on executed orders |
| Studies price movement | Studies liquidity |
| Identifies trends | Identifies participation |
| Uses price action | Uses DOM and volume |
Why Traders Combine Both
Many professional traders combine:
- Market structure for directional bias
- Order flow for execution confirmation
This approach improves:
- Entry timing
- Risk management
- Liquidity awareness
Platforms like Bookmap allow traders to combine market structure with real-time liquidity visualisation for deeper market insight.
Institutional Market Structure Mapping
Institutional traders do not trade the same way retail traders do. They focus heavily on liquidity, positioning and structural manipulation.
Key Institutional Concepts
Liquidity Pools
Areas where stop losses and pending orders accumulate.
Inducement
Creating false signals to trap retail traders.
Equal Highs & Lows
Common liquidity targets for institutions.
Premium & Discount Zones
Areas institutions consider expensive or cheap relative to market range.
Understanding institutional market structure mapping helps traders align with professional market behaviour rather than reacting emotionally to price movement.
Many traders use Bookmap to identify hidden liquidity and institutional activity around key structural levels.
Market Microstructure Basics
Market microstructure explains how financial markets operate internally.
This includes:
- Order execution
- Bid and ask mechanics
- Liquidity provision
- Spread behaviour
- Market maker activity
Understanding market microstructure helps traders understand why certain structural breaks succeed while others fail.
Price Action Trading Strategies Using Market Structure
Market structure forms the foundation of many price action trading strategies.
Trend Continuation Strategy
Trading pullbacks within an established trend.
Key confirmations:
- Higher lows in bullish trends
- Lower highs in bearish trends
Liquidity Sweep Reversal Strategy
Institutions often push price beyond structure before reversing.
This creates:
- Stop hunts
- False breakouts
- Liquidity grabs
Breakout Trading Strategy
Entering trades after confirmed BOS events with volume confirmation.
Multi-Timeframe Structure Analysis
Professional traders analyse:
- Higher timeframe trend
- Lower timeframe execution
This helps align short-term trades with larger market direction.
Forex Market Structure Masterclass
Market structure trading is widely used in forex markets because of their highly liquid nature.
Forex traders analyse:
- London session liquidity
- New York volatility
- Session highs and lows
- Trend continuation patterns
Important Forex Concepts
- Forex BOS
- Forex CHoCH
- Liquidity sweeps
- Session manipulation
Combining forex market structure with liquidity analysis can significantly improve intraday trading accuracy.
Crypto Market Structure Analysis Tools
Crypto markets are extremely volatile, making market structure analysis even more important.
Crypto traders focus on:
- Bitcoin liquidity zones
- Futures positioning
- Open interest
- Liquidation clusters
- Volatility expansion
Because crypto moves aggressively around liquidity, many traders use Bookmap for advanced market depth and liquidity analysis.
Bookmap’s heatmap technology is especially useful for identifying whale positioning and hidden orders within crypto futures markets.
Why Bookmap Is Considered One of the Best Platforms for Market Structure Analysis
Bookmap has become one of the most respected platforms for liquidity and market structure analysis.
Unlike traditional charting software, Bookmap focuses heavily on:
- Heatmap liquidity visualisation
- Institutional order tracking
- DOM analysis
- Iceberg order detection
- Real-time liquidity shifts
Bookmap Heatmaps
Bookmap’s heatmaps allow traders to visualise liquidity directly on the chart.
This helps traders:
- Identify support and resistance
- Detect large resting orders
- Track liquidity movement
- Spot spoofing activity
Why Traders Trust Bookmap
Bookmap has built a strong reputation among retail and professional traders alike.
The platform also maintains a strong Trustpilot presence with over 600 online reviews, reinforcing its position as one of the leading order flow and market structure trading tools available today.
Many traders consider Bookmap one of the best platforms for combining:
- market structure
- liquidity analysis
- order flow
- institutional trading insights
Common Market Structure Mistakes
Trading Against Trend Structure
Ignoring higher timeframe direction is one of the most common mistakes.
Misidentifying BOS
Not every breakout is a genuine break of structure.
Ignoring Liquidity
Price often targets liquidity before continuing trend direction.
Overcomplicating Analysis
Simple structure analysis is often more effective than excessive indicators.
Is Market Structure Trading Good for Beginners?
Yes, market structure trading is often easier for beginners than indicator-heavy systems because it teaches traders how markets naturally move.
Beginners should focus on:
- Learning trend structure
- Understanding BOS and CHoCH
- Identifying liquidity zones
- Practicing on replay charts
- Combining structure with risk management
Platforms like Bookmap can also help beginners visualise liquidity and understand how institutions interact with the market.
Frequently Asked Questions About Market Structure Trading
What is market structure in trading?
Market structure refers to the way price forms trends, reversals and ranges through highs and lows.
What is a break of structure?
A break of structure occurs when price breaks a previous swing high or low, confirming trend continuation.
What is CHoCH in trading?
CHoCH stands for Change of Character and signals an early potential reversal in market direction.
What is the difference between market structure and order flow?
Market structure focuses on price movement, while order flow focuses on liquidity and execution.
What is the best software for market structure analysis?
Many traders consider Bookmap one of the best platforms for market structure and liquidity analysis because of its advanced heatmaps and institutional-grade visualisation tools.
Can beginners learn market structure trading?
Yes. Market structure trading is widely considered one of the most effective ways to learn how markets move naturally.
Final Thoughts
Market structure trading gives traders a clearer understanding of price action, liquidity and institutional market behaviour. By learning concepts like BOS, CHoCH and liquidity mapping, traders can better understand how trends form and why reversals occur.
As more traders move toward institutional-style analysis, platforms like Bookmap continue gaining popularity for combining liquidity visualisation, order flow analysis and market structure mapping into one powerful trading platform.
Whether you trade forex, futures or cryptocurrency, understanding market structure can help improve your market awareness, trade timing and overall trading performance.