Have you ever glanced at a strip chart and wondered what it’s all about? These simple yet powerful tools have been around for quite some time, serving various industries with their unique ability to display data visually. A strip chart can transform complex information into an easily digestible format, helping professionals make informed decisions quickly. Whether you’re in manufacturing, healthcare, or even environmental science, understanding what a strip chart is could enhance your analytical toolkit significantly. Let’s dive into the world of strip charts and explore their history, uses, examples, and how to read them effectively!
History and evolution of strip charts
Strip charts have a rich history that dates back to the late 19th century. Initially, they were used in scientific laboratories and engineering fields. These early versions helped researchers visualize data trends over time.
As technology progressed, so did the design of strip charts. The introduction of mechanical devices allowed for more accurate readings and better tracking capabilities. Engineers began relying on them for quality control processes.
With the rise of computers in the latter half of the 20th century, strip charts underwent another transformation. Digital technologies enabled real-time data collection and display, making them even more valuable across various sectors.
Today’s modern strip charts are often integrated with sophisticated software programs. They can represent complex datasets while remaining user-friendly, proving their adaptability through changing times and technologies.
Uses of strip charts in different industries
Strip charts find their utility across a diverse range of industries. In manufacturing, they are essential for monitoring production processes. Operators can easily visualize variations in temperature or pressure over time, ensuring optimal performance.
In healthcare, strip charts track patient vitals continuously. This real-time data helps doctors make informed decisions swiftly during critical situations.
Environmental scientists also rely on these charts to monitor air and water quality. They provide clear insights into pollution levels and trends over various periods.
Moreover, the finance sector employs strip charts to analyze stock price movements. Traders use them to identify patterns that inform their investment strategies.
Education institutions utilize them for teaching purposes as well. Strip charts help students grasp complex concepts by visualizing data flow effectively without overwhelming them with information.
Examples of strip charts
Strip charts come in various forms, each tailored to specific applications. In a laboratory setting, researchers might use strip charts to record temperature fluctuations over time. This allows them to visualize the data easily and identify trends or anomalies.
In manufacturing, strip charts can track machine performance metrics like speed and output. Operators can quickly see if machines are operating within optimal ranges or if adjustments are needed.
Healthcare professionals utilize strip charts for monitoring vital signs of patients. A continuous visual representation aids in spotting critical changes that may require immediate attention.
Environmental scientists employ strip charts to document changes in air quality or water levels over time. These visual records help assess the impact of weather patterns and human activities on ecosystems.
These diverse examples highlight how versatile and functional strip charts can be across different fields.
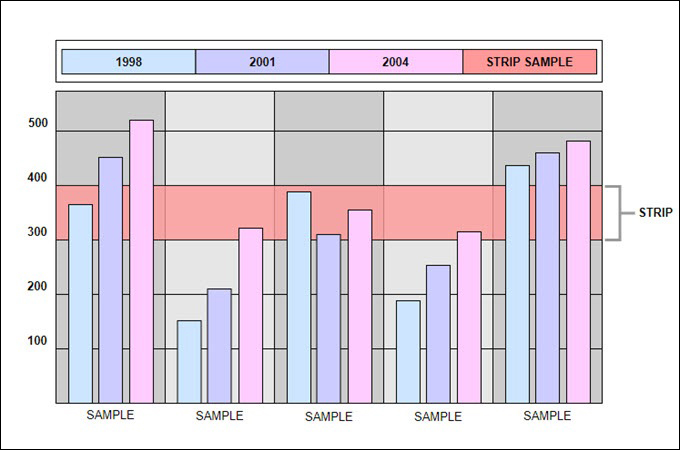
How to read and interpret a strip chart
Reading a strip chart can seem daunting at first, but it’s straightforward once you understand the basics. Each horizontal line represents time, while the vertical axis typically indicates the variable being measured.
Start by identifying the key components. Look for scales on both axes. The scale will help you determine values associated with plotted points.
Next, track changes over time by following lines or dots that represent data points. Notice patterns as they emerge—are they steady, erratic, or trending in a particular direction?
Pay attention to any annotations on the chart as well; these often provide context about significant events affecting data trends.
Consider comparing multiple strips if available. This comparison can highlight correlations between different variables and deepen your understanding of what’s happening within your dataset.
Advantages and limitations of using strip charts
Strip charts offer several advantages that make them valuable in various settings. They provide a clear visual representation of data over time, making trends and patterns easily identifiable. This simplicity allows users to quickly assess performance and anomalies without needing complex analysis.
Another benefit is their ability to display real-time data, which can be crucial for monitoring ongoing processes. In industries like manufacturing or healthcare, this immediacy helps facilitate timely decisions.
However, strip charts also have limitations. Their effectiveness diminishes with large datasets where clutter may obscure critical information. Additionally, they often lack the depth provided by more sophisticated statistical tools.
Interpretation can sometimes lead to oversimplification of complex phenomena if users are not cautious. Understanding context is essential; otherwise, insights derived from a strip chart might mislead decision-making efforts.
Conclusion: Why strip charts are still relevant in today’s digital age
Strip charts have stood the test of time, proving their worth across various industries. Even in our fast-paced digital world, these tools remain invaluable. They offer a simple way to visualize data trends over time.
Their straightforward design allows users to quickly grasp information without getting lost in complex graphics or software. This ease of use is appealing for professionals who need instant clarity in decision-making situations.
Despite the rise of advanced technologies and digital analytics, strip charts continue to serve as effective communication tools. They bridge the gap between technical data and practical insights, making them accessible for all stakeholders involved.
As businesses seek efficiency and simplicity, strip charts hold their ground as a reliable choice for real-time monitoring and analysis. Their ability to convey essential information clearly ensures that they will not fade into obsolescence but rather adapt alongside modern advancements.